
RTX Free Financial Model Download
RTX Corporation
RTX Corporation is a leading global aerospace and defence company that provides advanced systems and services for commercial, military, and government customers worldwide. The company operates through three principal business segments: Collins Aerospace (approximately 33% of revenue), Pratt & Whitney (approximately 34% of revenue), and Raytheon (approximately 33% of revenue).
Free download. No sign-up required. Built from SEC EDGAR data.
About this model
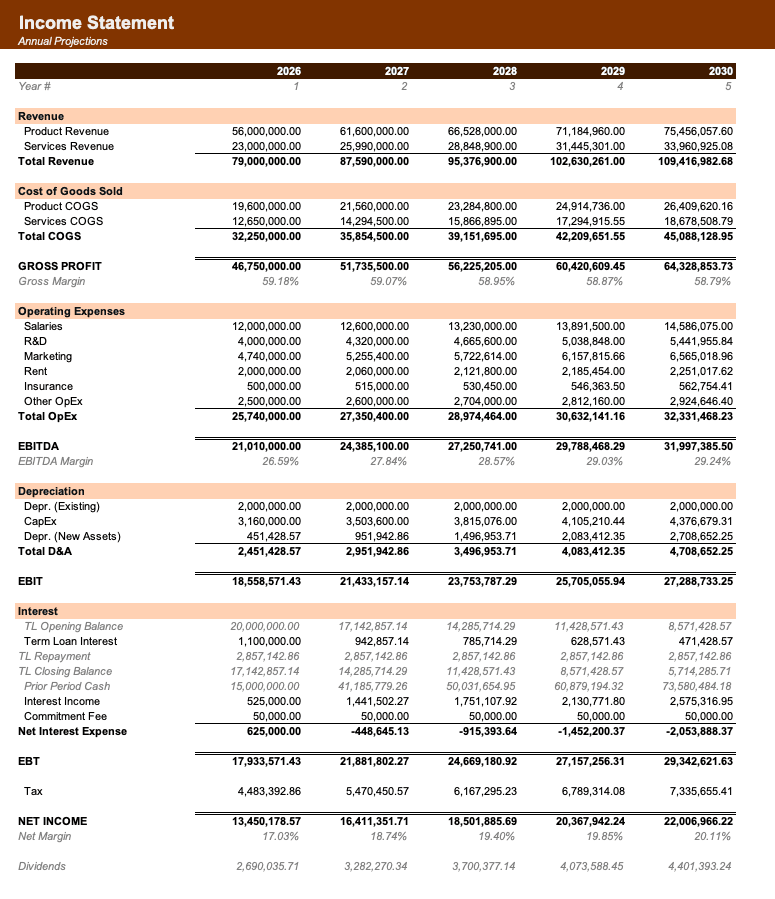
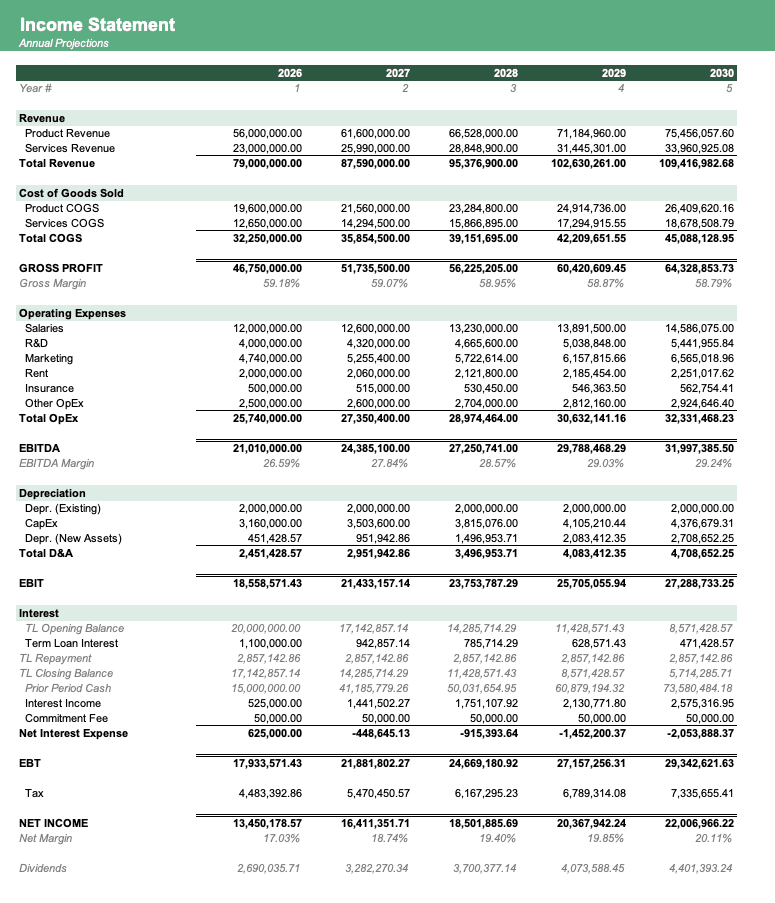
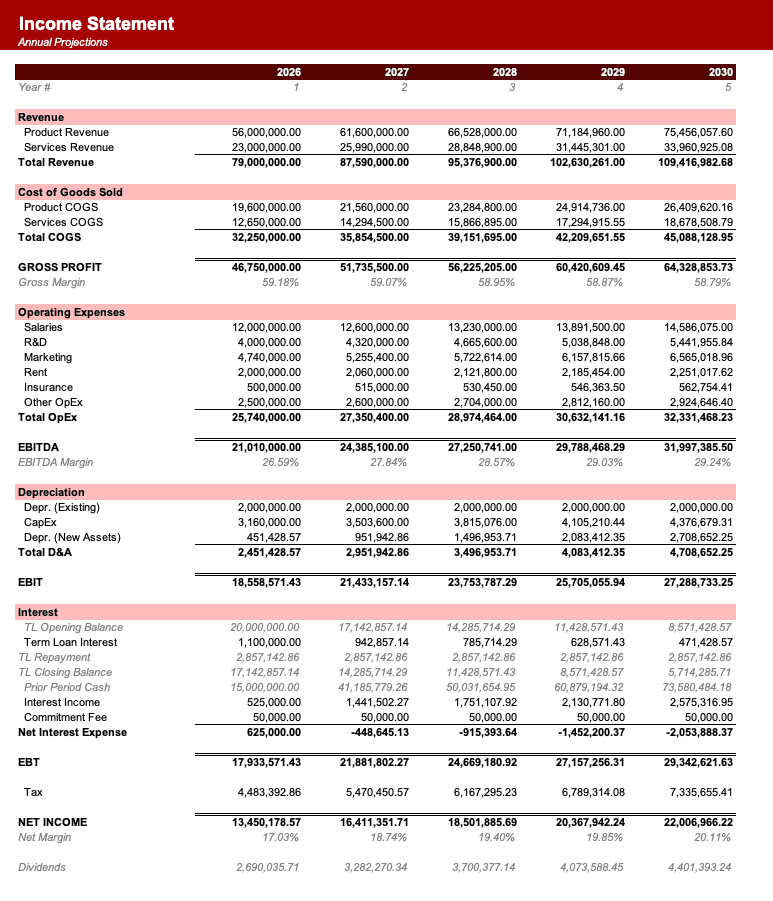
This model forecasts RTX Corporation's consolidated financial performance and cash flow generation to determine its equity valuation, with a specific focus on quantifying the multi-year cash flow impact of the Pratt & Whitney GTF engine powder metal recall.
Recolor to your brand.
Formatted to IB standards.
Named theme colors repaint the whole workbook in one click, on top of an investment-banking structure with blue inputs, black formulas, and green cross-sheet links.
- Brand-ready
- Institutional grade
- Fully auditable
Historicals & Assumptions used in
the RTX financial model
Source: SEC EDGAR · values in USD
| Line item | FY2021 | FY2022 | FY2023 | FY2024 | FY2025 |
|---|---|---|---|---|---|
| Revenue | $45.35B | $56.59B | $64.39B | $67.07B | $68.92B |
| Gross profit | — | — | — | — | — |
| Operating income | $4.91B | -$1.89B | $5.14B | $5.50B | $3.56B |
| Net income | $5.54B | -$3.52B | $3.86B | $5.20B | $3.19B |
Forecast assumptions
Defaults used in the downloadable model. Forecast horizon: FY2026–FY2030.
See 8 moreSee less
How to build a detailed financial model for RTX
A complete walkthrough of every driver, margin, working-capital input, and capital-allocation assumption used in the downloadable model.
Revenue Deep Dive
Collins Aerospace
- Segment Name: Collins Aerospace
- Revenue Driver Formula: (Commercial OEM Build Rates x Shipset Value) + (Commercial Flight Hours x Aftermarket Capture Rate) + Defense Contract Awards
- Historical Growth Rate: 6-10% CAGR (recovering from pandemic lows)
- Key Growth Levers and Headwinds: Driven by Airbus and Boeing production rates, global passenger air traffic, and defence spending. Supply chain bottlenecks remain a headwind.
- Pricing Dynamics: Long-term contractual pricing with inflation escalation clauses.
- Revenue Recognition Notes: Over time using the cost-to-cost method for defence; point-in-time for commercial spare parts.
- Seasonality: Fourth quarter is typically the strongest due to year-end defence budget spending and commercial delivery pushes.
Pratt & Whitney
- Segment Name: Pratt & Whitney
- Revenue Driver Formula: (Engine Deliveries x Price per Engine) + (Shop Visits x Revenue per Shop Visit)
- Historical Growth Rate: 10-18% CAGR
- Key Growth Levers and Headwinds: Growth driven by A320neo family deliveries and military F135 engine upgrades. The GTF powder metal issue restricts new engine delivery growth as resources are diverted to maintenance.
- Pricing Dynamics: Engines are often sold at a loss or low margin; profitability is recouped through long-term flight-hour maintenance agreements.
- Revenue Recognition Notes: Power-by-the-hour contracts require complex deferred revenue accounting based on flight hours flown versus maintenance performed.
- Seasonality: Relatively smooth, though Q4 sees higher military deliveries.
Raytheon
- Segment Name: Raytheon
- Revenue Driver Formula: Beginning Backlog x Backlog Conversion Rate + In-Period Book-to-Bill
- Historical Growth Rate: 3-5% CAGR
- Key Growth Levers and Headwinds: Driven by global defence budgets, replenishment of munitions (e.g., Patriot, NASAMS) from global conflicts, and foreign military sales.
- Pricing Dynamics: Mix of fixed-price (higher risk/reward) and cost-plus (lower risk/margin) government contracts.
- Revenue Recognition Notes: Almost entirely recognised over time using the percentage-of-completion (cost-to-cost) method.
- Seasonality: Heavy Q4 weighting aligned with the US Department of Defense procurement cycle.
Cost Structure
Variable Costs / COGS
- Line-by-line breakdown: Manufacturing labour, raw materials (titanium, aluminium, composites), sub-tier supplier components, and warranty provisions.
- Gross margin range: 18-22% historically.
- Key input costs: Highly exposed to aerospace-grade metals, skilled manufacturing labour, and global freight.
- Scaling dynamics: High operating leverage in aftermarket services; OEM production is step-function dependent on factory capacity.
Operating Expenses
- R&D: Total R&D is roughly 9-10% of sales, but customer-funded R&D sits in COGS. Company-funded R&D sits in operating expenses and typically runs at 4-5% of revenue.
- SG&A: Typically 9-11% of revenue, largely headcount-driven (corporate functions, IT, sales).
- Depreciation & Amortisation: High due to the capital-intensive nature of test cells and manufacturing, plus significant acquisition-related intangible amortisation from the UTC/Raytheon merger.
- Stock-Based Compensation: Approximately 0.5-1.0% of revenue.
- Restructuring / one-time charges: Frequent footprint consolidation charges and massive one-time warranty charges (e.g., the $3 billion GTF charge in 2023).
Margin Profile
- Gross margin: 18-22%
- EBITDA margin: 14-17%
- Operating margin: 10-12% (adjusted)
- Margin trend: Expanding as higher-margin commercial aftermarket volumes recover and outpace lower-margin OEM deliveries.
- Segment margins: Collins (~14-15%), Pratt & Whitney (~7-9%, heavily burdened by GTF costs), Raytheon (~9-11%).
Balance Sheet Structure
- Total assets: Approximately $160 billion.
- Key asset categories: Contract assets (unbilled receivables), inventory, PP&E, and massive goodwill/intangibles.
- Goodwill & intangibles: Accounts for roughly 60-65% of total assets due to the UTC/Raytheon merger and the Rockwell Collins acquisition.
- Working capital profile:
- Days Sales Outstanding (DSO): 60-75 days.
- Days Inventory Outstanding (DIO): 90-110 days (long manufacturing cycles).
- Days Payable Outstanding (DPO): 70-85 days.
- Net working capital: Typically positive and a significant use of cash during growth phases.
- PP&E: Consists of manufacturing facilities, tooling, and engine test cells. Useful lives range from 10 to 40 years.
- Right-of-use assets: Material but manageable, representing facility and equipment leases.
Capital Expenditure & Investment
- Capex as % of revenue: 3.0-4.5% (roughly $2.5-$3.0 billion annually).
- Maintenance vs. growth: Approximately 40% maintenance, 60% growth (tooling for new engine ramps and expanding MRO shop capacity).
- Major capex programmes: Expanding Pratt & Whitney MRO network to handle the surge in GTF engine removals and inspections.
- Capitalised software: Moderate, related to internal ERP consolidations.
- M&A pattern: Historically transformational (UTC/Raytheon, Rockwell Collins), but currently focused on organic growth and portfolio pruning (e.g., sale of Cybersecurity business in 2024).
Debt & Capital Structure
- Total debt: Approximately $40-$45 billion.
- Debt/EBITDA ratio: Target is around 2.5x to 3.0x.
- Credit rating: Investment grade (typically A- or BBB+ equivalent).
- Key debt instruments: Unsecured senior notes with staggered maturities, backed by a large revolving credit facility.
- Maturity profile: Well-laddered, with average maturities exceeding 8 years.
- Interest rate profile: Predominantly fixed-rate bonds.
- Share repurchase programme: Highly active. The company executed a $10 billion accelerated share repurchase in late 2023 and continues to buy back shares annually.
- Dividend policy: Progressive dividend policy with a yield of roughly 2.0-2.5% and an annual growth rate of 5-7%.
Cash Flow Characteristics
- Operating cash flow conversion: OCF to Net Income is typically 1.2x to 1.5x, driven by high non-cash depreciation and amortisation.
- Free cash flow margin: 7-10% of revenue historically, though depressed in 2024/2025 due to GTF compensation payments.
- Major non-cash items: Depreciation, intangible amortisation, stock-based compensation, and deferred tax adjustments.
- Working capital cash flow impact: Inventory build for the aerospace supercycle and contract asset growth are major uses of cash.
- Cash tax rate: Often differs from the GAAP rate due to R&D capitalisation rules (Section 174) which accelerate cash tax payments.
Sheet Structure
- Assumptions: Hardcoded drivers for macroeconomic inputs, segment growth, margins, and capital allocation.
- Scenarios: Live toggles for Base, Bull, and Bear cases, specifically flexing the GTF cash compensation timeline.
- Revenue_Build: Segment-level build for Collins Aerospace, Pratt & Whitney, and Raytheon, including backlog roll-forwards.
- Income_Statement: Consolidated P&L from revenue down to GAAP and Adjusted Net Income.
- Balance_Sheet: Standard assets, liabilities, and equity, highlighting contract assets and contract liabilities.
- Cash_Flow: Indirect method starting from Net Income, with a specific line item for GTF compensation cash outflows.
- Debt_Schedule: Tranche-by-tranche bond maturities, interest expense calculation, and revolver draw logic.
- Working_Capital: DSO, DIO, DPO schedules, plus percentage-of-completion contract asset/liability mechanics.
- PP_and_E: Capex, depreciation waterfall, and net PP&E roll-forward.
- Intangibles: Goodwill and acquisition-related intangible amortisation schedules.
- Equity_and_Dividends: Share count roll-forward, EPS calculations, dividend payouts, and share repurchases.
- DCF_Valuation: Unlevered free cash flow calculation, WACC build, and terminal value derivation.
Key Financial Relationships
- `Collins Aerospace Revenue = Commercial OEM Revenue + Commercial Aftermarket Revenue + Defense Revenue`
- `Pratt & Whitney Revenue = Commercial Engines Revenue + Military Engines Revenue + Pratt Canada Revenue`
- `Raytheon Revenue = (Beginning Backlog x Backlog Conversion Rate) + New Awards`
- `Consolidated Adjusted Net Sales = Collins Revenue + Pratt & Whitney Revenue + Raytheon Revenue - Intersegment Eliminations`
- `Segment Operating Profit = Segment Revenue x Segment Adjusted Operating Margin`
- `Consolidated Operating Profit = Sum of Segment Operating Profits - Unallocated Corporate Expenses - FAS/CAS Operating Adjustment`
- `GTF Cash Outflow = Grounded Aircraft x Average Compensation per Aircraft per Quarter`
- `Reported Free Cash Flow = Operating Cash Flow - Capital Expenditures`
- `Ending Backlog = Beginning Backlog + New Awards - Recognised Revenue`
- `Interest Expense = (Beginning Total Debt + Ending Total Debt) / 2 x Weighted Average Interest Rate`
- `Ending Shares Outstanding = Beginning Shares Outstanding - (Share Repurchase Amount / Average Share Price) + Stock Based Comp Issuances`
- `Contract Assets = Raytheon and Defense Revenue x Contract Asset Days / 365`
Cross-Sheet Dependencies
- The Revenue_Build sheet dictates the top line in the Income_Statement and drives the backlog figures in the Working_Capital sheet.
- The Income_Statement generates Net Income, which is the starting point for the Cash_Flow sheet.
- The Cash_Flow sheet determines the cash available for the Debt_Schedule (revolver paydown) and Equity_and_Dividends (share repurchases).
- The Debt_Schedule calculates interest expense, which feeds back into the Income_Statement (creating a circular reference that requires an iterative calculation or a circuit breaker).
- The PP_and_E and Intangibles sheets feed depreciation and amortisation into both the Income_Statement and the Cash_Flow sheet.
Sign Convention
- Revenue, Assets, and Equity are represented as positive numbers.
- Expenses (COGS, SG&A, Interest, Taxes) are represented as negative numbers on the Income Statement.
- Cash inflows are positive and cash outflows (Capex, Dividends, Repurchases) are negative on the Cash Flow Statement.
- Contra-assets (Accumulated Depreciation) are represented as negative numbers.
Things Most Likely to Go Wrong
- Failing to separate the $3 billion non-cash GTF charge taken in 2023 from the actual cash outflows occurring in 2024-2026.
- Mismodelling the FAS/CAS pension adjustment, which creates a wedge between segment operating profit and consolidated operating profit.
- Ignoring intersegment eliminations, which typically reduce consolidated revenue by $2-$3 billion annually.
- Overestimating free cash flow by failing to account for the cash tax headwinds caused by Section 174 R&D capitalisation rules.
- Miscalculating the share count reduction; the $10 billion accelerated share repurchase in 2023 heavily skewed the weighted average shares outstanding for 2024.
- Treating acquisition-related intangible amortisation as a cash expense; it must be added back to calculate adjusted EPS and free cash flow.
- Failing to account for the divestiture of the Cybersecurity business in Q1 2024, which makes historical Raytheon segment revenue non-comparable without pro-forma adjustments.
- Modelling working capital linearly; aerospace working capital is highly lumpy due to the timing of government advance payments (contract liabilities).
Validation Checks
- Consolidated Adjusted Operating Margin should remain between 10.0% and 12.5%; flag if it falls outside this range.
- Capex as a percentage of revenue must stay between 3.0% and 4.5%.
- The balance sheet must balance perfectly in every forecast period (Total Assets = Total Liabilities + Equity).
- Free Cash Flow conversion (FCF / Adjusted Net Income) should trend towards 90-110% by 2026 as GTF penalty payments subside.
- Debt/EBITDA should not exceed 3.5x to maintain the investment-grade rating profile.
- Intersegment eliminations should be negative and equal approximately 3-4% of gross segment sales.
- The effective tax rate should remain between 18% and 21%.
Key Assumptions (Default Values)
| Assumption | Default Value | Unit | Rationale |
|---|---|---|---|
| Collins Aerospace Revenue Growth | 7.0 | % | Reflects continued commercial aerospace recovery and aftermarket demand. |
| Pratt & Whitney Revenue Growth | 12.0 | % | Driven by higher MRO output and military deliveries. |
| Raytheon Revenue Growth | 4.0 | % | Based on backlog conversion and steady defence budget outlays. |
| Intersegment Eliminations | -3.5 | % of Gross Sales | Historical average for internal transfers between segments. |
| Collins Adjusted Operating Margin | 15.0 | % | Reflects favourable mix shift towards commercial aftermarket. |
| Pratt & Whitney Adjusted Operating Margin | 8.0 | % | Burdened by GTF engine support costs and negative OEM margins. |
| Raytheon Adjusted Operating Margin | 10.0 | % | Standard margin for fixed-price and cost-plus defence contracts. |
| SG&A as % of Revenue | 10.0 | % | Stable corporate overhead requirement. |
| Effective Tax Rate | 19.5 | % | Blended global tax rate post-US tax reform. |
| Capex as % of Revenue | 3.5 | % | Required to support GTF MRO expansion and new facilities. |
| Dividend Payout Ratio | 45.0 | % | Aligns with management's capital return commitments. |
| Annual Share Repurchases | 3,000 | $ Millions | Normalised run-rate following the 2023 accelerated programme. |
| Weighted Average Interest Rate | 4.5 | % | Blended rate of existing fixed-rate senior notes. |
| WACC | 8.5 | % | Standard discount rate for large-cap aerospace prime contractors. |
| Terminal Growth Rate | 2.5 | % | Aligns with long-term global GDP and defence spending growth. |
Data Sources & Benchmarks
- Filings: RTX Investor Relations website, SEC EDGAR (Form 10-K, 10-Q, 8-K).
- Peers for Benchmarking: Lockheed Martin (LMT), General Dynamics (GD), GE Aerospace (GE), Boeing (BA).
- Industry Data: Airline capacity data (OAG, CAPA), US Department of Defense budget requests (Comptroller website), Airbus and Boeing monthly delivery reports.
- Consensus Estimates: FactSet, Bloomberg, or Yahoo Finance for near-term EPS and revenue consensus.
Sources
- RTX Q4 2024 Earnings Release (rtx.com)
- RTX Posts 9% Sales Growth in Q4 2024 (govconwire.com)
- RTX Reports 2023 Results and Announces 2024 Outlook (rtx.com)
- RTX Reports 2024 Results and Announces 2025 Outlook (rtx.com)
- RTX provides update on Pratt & Whitney GTF fleet (rtx.com)
- Pratt & Whitney Looks Toward New Technologies To Improve GTF Engine Durability (simpleflying.com)
- RTX Corporation: The Aerospace Cash Powerhouse Despite GTF Crisis (seekingalpha.com)
- GTF Powder Metal Issues Impact RTX Full Year Results (aviationnews-online.com)
- Form 10-K for RTX Corp filed 02/05/2024 (SEC EDGAR)
Other Industrials models
Browse another company in the same sector.
Frequently asked
What does RTX Corporation do and what are its main business segments?+
RTX Corporation is a leading global aerospace and defence company that provides advanced systems and services for commercial, military, and government customers worldwide. It operates through three principal business segments: Collins Aerospace, Pratt & Whitney, and Raytheon, each contributing approximately one-third of its revenue.
How does RTX Corporation generate revenue, and what is its business model?+
RTX operates an asset-heavy, long-term contract business model characterized by high initial development costs and lower-margin original equipment manufacturing (OEM) sales. A significant portion of its revenue and profitability comes from highly profitable long-term aftermarket maintenance and repair services.
What is RTX Corporation's typical capital expenditure as a percentage of revenue?+
RTX Corporation's capital expenditure typically ranges from 3.0-4.5% of revenue, which translates to roughly $2.5-$3.0 billion annually. This capex is approximately 40% for maintenance and 60% for growth, including tooling for new engine ramps and expanding MRO shop capacity.
What is the primary purpose of the RTX Corporation financial model?+
The primary purpose of this financial model is to forecast RTX Corporation's consolidated financial performance and cash flow generation to determine its equity valuation. It specifically focuses on quantifying the multi-year cash flow impact of the Pratt & Whitney GTF engine powder metal recall.
Why are goodwill and intangibles a significant portion of RTX Corporation's assets?+
Goodwill and intangibles account for roughly 60-65% of RTX Corporation's total assets, which are approximately $160 billion. This substantial amount is primarily due to past transformational mergers and acquisitions, such as the UTC/Raytheon merger and the Rockwell Collins acquisition.
For what forecast period does the downloadable RTX financial model provide projections?+
The downloadable RTX financial model provides financial projections for a forecast horizon spanning from Fiscal Year 2026 through Fiscal Year 2030. This general corporate model helps analyze the company's future financial performance and cash flow generation.
Want to build your own RTX financial model?
Copy a ready-to-use prompt with every driver, historical, and assumption baked in — or have a custom model built for you.
The prompt includes the full company brief, 5 years of SEC historicals, and the default forecast assumptions used in the downloadable model.

Alex Tapio
Founder of Finamodel • Professional Financial Modeller • Ex-Deloitte