
Comfort Systems USA Free Financial Model Download
Comfort Systems USA is a leading national provider of mechanical, electrical, and plumbing (MEP) contracting services, focusing heavily on commercial, industrial, and institutional markets. The company designs, engineers, integrates, installs, and maintains HVAC, plumbing, piping, and electrical systems, with a recent strategic expansion into modular construction for advanced technology and semiconductor fabrication plants.
Free download. No sign-up required. Built from SEC EDGAR data.
About this model
This model provides a comprehensive three-statement forecast and discounted cash flow (DCF) valuation for Comfort Systems USA (FIX) to help an equity research analyst determine the intrinsic value of the shares and assess the financial impact of its ongoing roll-up acquisition strategy.
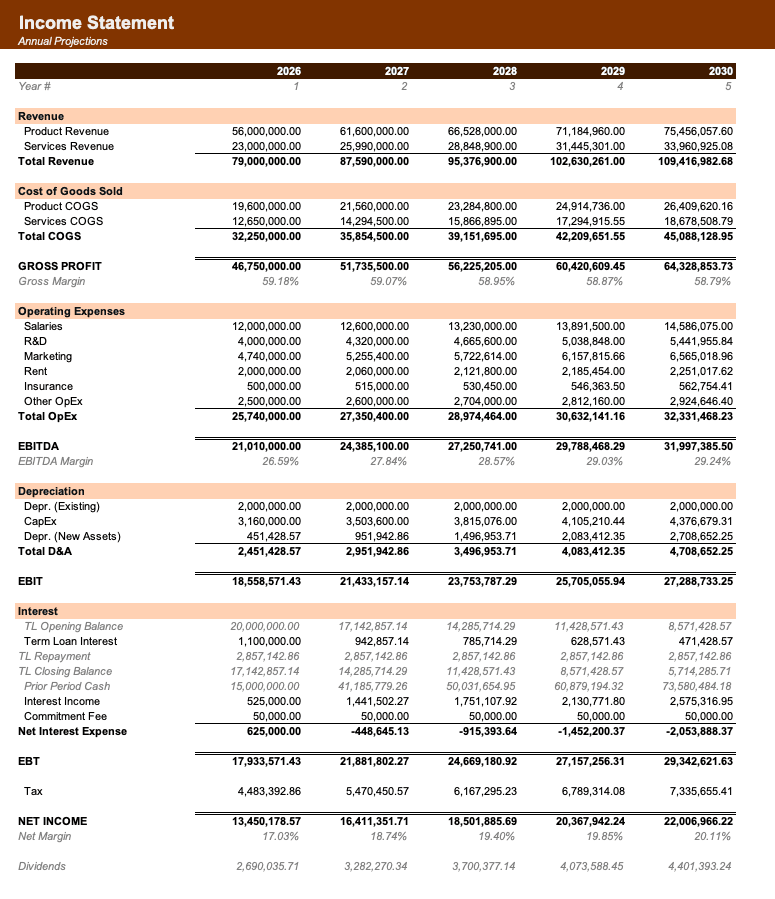
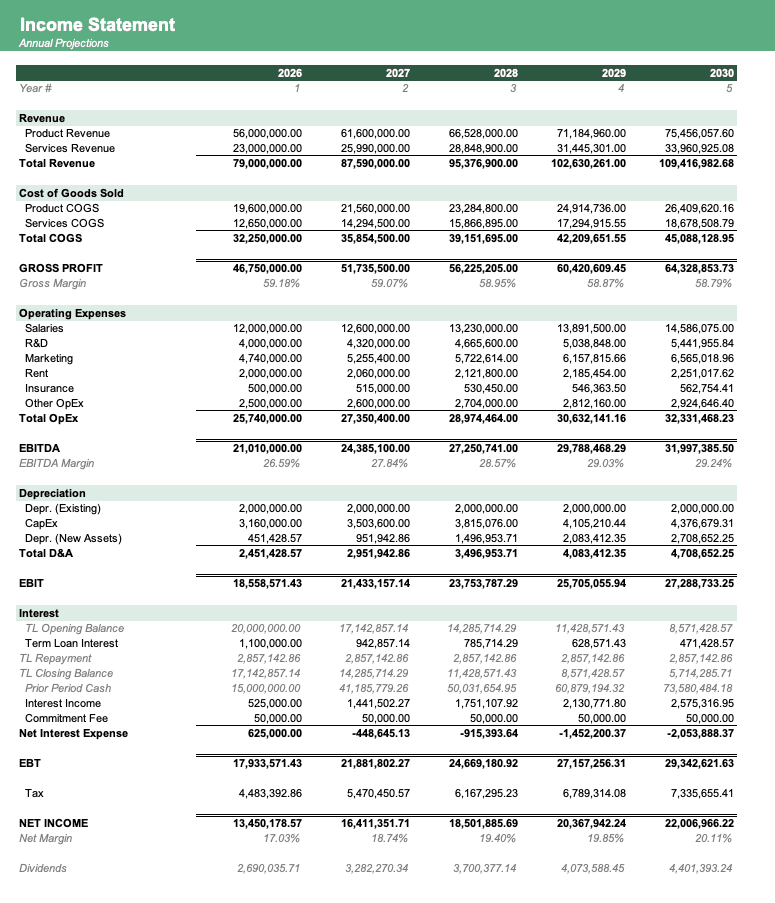
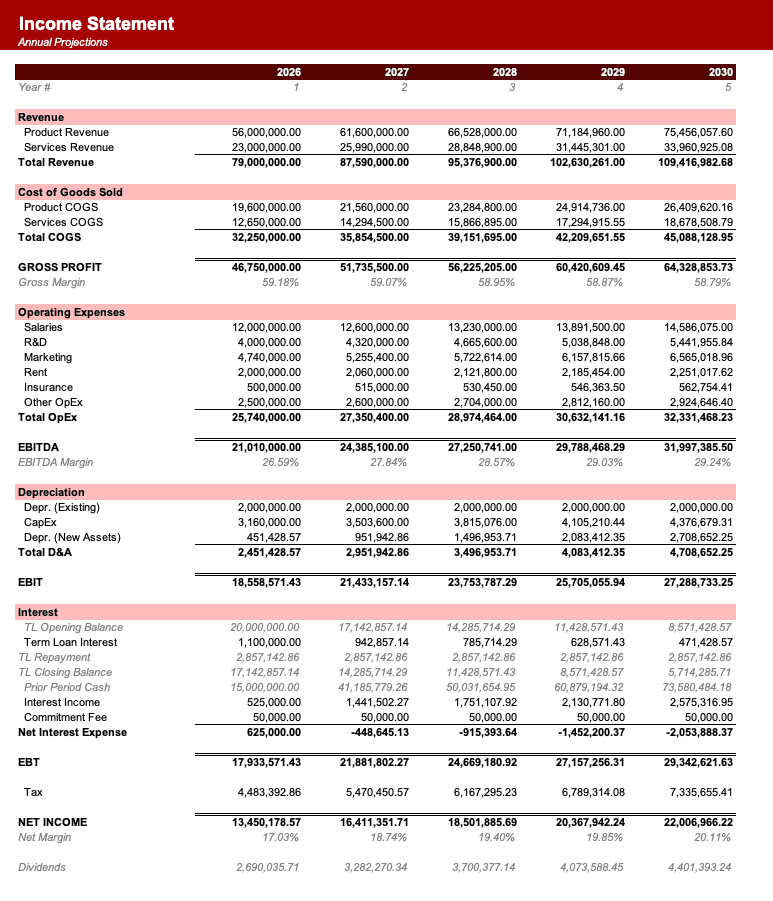
Recolor to your brand.
Formatted to IB standards.
Named theme colors repaint the whole workbook in one click, on top of an investment-banking structure with blue inputs, black formulas, and green cross-sheet links.
- Brand-ready
- Institutional grade
- Fully auditable
Historicals & Assumptions used in
the Comfort Systems USA financial model
Source: SEC EDGAR · values in USD
| Line item | FY2021 | FY2022 | FY2023 | FY2024 | FY2025 |
|---|---|---|---|---|---|
| Revenue | $2.62B | $2.86B | $3.07B | $4.14B | $5.21B |
| Gross profit | $501.9M | $547.0M | $563.2M | $741.6M | $990.5M |
| Operating income | $163.6M | $190.7M | $188.4M | $253.8M | $418.4M |
| Net income | $114.3M | $150.1M | $143.3M | $245.9M | $323.4M |
Forecast assumptions
Defaults used in the downloadable model. Forecast horizon: FY2026–FY2030.
See 8 moreSee less
How to build a detailed financial model for Comfort Systems USA
A complete walkthrough of every driver, margin, working-capital input, and capital-allocation assumption used in the downloadable model.
Revenue Deep Dive
Mechanical Services
- Segment Name: Mechanical
- Revenue Driver Formula: (Beginning Mechanical Backlog x Mechanical Burn Rate) + In-Period Book-and-Bill + Acquired Revenue
- Historical Growth Rate: 20-30% CAGR over the last 3 years (heavily boosted by M&A and data centre demand).
- Key Growth Levers and Headwinds: Driven by industrial on-shoring, semiconductor fabrication plant construction, and data centre cooling requirements. Headwinds include skilled labour shortages and supply chain delays for HVAC equipment.
- Pricing Dynamics: Primarily fixed-price contracts bid on a project basis, with pricing power currently strong due to unprecedented demand in the advanced technology sector.
- Revenue Recognition Notes: Recognised over time using the percentage-of-completion method based on costs incurred relative to total estimated costs.
- Seasonality: Mild seasonality; the first quarter is typically the weakest due to winter weather impacting outdoor construction activities.
Electrical Services
- Segment Name: Electrical
- Revenue Driver Formula: (Beginning Electrical Backlog x Electrical Burn Rate) + In-Period Book-and-Bill + Acquired Revenue
- Historical Growth Rate: 15-25% CAGR over the last 3 years.
- Key Growth Levers and Headwinds: Driven by the electrification trend, data centre power requirements, and cross-selling with the Mechanical segment.
- Pricing Dynamics: Fixed-price and time-and-materials contracts.
- Revenue Recognition Notes: Percentage-of-completion for large projects; as-incurred for maintenance and service work.
- Seasonality: Similar to Mechanical, with Q1 generally being the slowest.
*Note: The company also breaks down revenue by activity type (New Construction ~63%, Existing Building Construction ~30%, Service/Maintenance ~7%), but segment reporting is strictly Mechanical vs. Electrical.*
Cost Structure
Variable Costs / COGS
- Line-by-line breakdown: Direct labour, materials (pipe, sheet metal, copper), equipment (chillers, air handlers, switchgear), and subcontractor costs.
- Gross margin range: 18.0% to 24.1% over the last 5 years (hitting a record 24.1% in FY2025).
- Key input costs: Union and non-union skilled labour wages, steel, copper, and aluminium prices.
- How COGS scales: Highly variable. Subcontractor and material costs scale linearly with project volume. Gross margin expansion recently has been driven by excellent project execution and high demand allowing for better pricing.
Operating Expenses
- R&D: Not material / not reported.
- SG&A: Selling, General and Administrative expenses include corporate overhead, branch management salaries, IT, and marketing. Typically runs at 9.0% to 10.5% of revenue.
- Depreciation & Amortisation: D&A is heavily skewed towards amortisation of acquired intangible assets (customer relationships, trade names) due to the roll-up strategy. Total D&A is typically 1.5% to 2.5% of revenue.
- Stock-Based Compensation: Relatively small, typically under 0.5% of revenue.
- Restructuring / one-time charges: Rare, though M&A integration costs occasionally appear in SG&A.
Margin Profile
- Gross margin: 18.0% - 24.1% (expanding).
- EBITDA margin: 8.0% - 16.0% (FY2025 Adjusted EBITDA margin was approx. 16.0%).
- Operating margin: 7.0% - 14.4% (FY2025 operating margin was 14.4%).
- Net margin: 5.0% - 11.2% (FY2025 net margin was 11.2%).
Balance Sheet Structure
- Total assets: Approximately $4.5 to $5.5 billion.
- Key asset categories: Accounts receivable, Costs and estimated earnings in excess of billings (contract assets), Goodwill, and Intangible assets.
- Goodwill & intangibles: Extremely high due to the M&A strategy, often representing 40-50% of total assets.
- Working capital profile:
- Days Sales Outstanding (DSO): 70-85 days.
- Days Inventory Outstanding (DIO): Not material (materials are usually drop-shipped to job sites and billed to projects).
- Days Payable Outstanding (DPO): 50-65 days.
- Net working capital: The company relies heavily on the relationship between "Costs in excess of billings" (asset) and "Billings in excess of costs" (liability). Cash flow is often front-loaded on projects due to over-billing, creating a negative working capital dynamic that funds growth.
- PP&E: Very light. Consists mostly of service vans, fabrication shop equipment, and IT hardware. Represents less than 5% of total assets.
- Right-of-use assets: Operating leases for branch offices and warehouse spaces are material but manageable.
Capital Expenditure & Investment
- Capex as % of revenue: 1.0% to 1.5% (highly asset-light).
- Maintenance capex vs. growth capex: Mostly maintenance (vehicle fleet replacement, tool upgrades, fabrication shop maintenance).
- Major capex programmes: Investments in modular construction fabrication facilities (e.g., Summit Industrial) and electric vehicle pilot programmes.
- M&A pattern: Serial acquirer. The company completes 2-4 bolt-on or transformational acquisitions per year (e.g., Summit, J&S Mechanical, Feyen Zylstra).
- Typical acquisition multiple paid: Typically 6.0x to 8.0x trailing EBITDA, though larger strategic assets like Summit may command slight premiums.
Debt & Capital Structure
- Total debt: $145 million (as of December 31, 2025).
- Cash: $981 million (as of December 31, 2025), resulting in a massive net cash position.
- Debt/EBITDA ratio: 0.10x (gross debt to TTM EBITDA).
- Key debt instruments: $1.10 billion senior unsecured revolving credit facility maturing in 2030.
- Interest rate profile: Floating rate based on SOFR plus a spread, though currently, the company earns more interest on its cash than it pays on its debt.
- Share repurchase programme: Active. The company repurchased 0.4 million shares for approximately $217.9 million in 2025.
- Dividend policy: The company has increased its dividend for 14 consecutive years. The current annual payout is approximately $1.95 per share, representing a very low payout ratio (under 10% of net income).
Cash Flow Characteristics
- Operating cash flow conversion: OCF / Net Income is consistently strong, typically 1.0x to 1.2x. In FY2025, OCF was $1,186.4 million versus Net Income of $1,022.6 million.
- Free cash flow margin: 10.0% to 13.0% of revenue.
- Major non-cash items: Amortisation of intangibles (significant due to M&A), depreciation, and stock-based compensation.
- Working capital cash flow impact: Growth in backlog typically requires some working capital build, but strong over-billing practices mitigate this, often turning working capital into a source of cash during growth phases.
- Capex intensity: Very low, driving high free cash flow conversion.
- Cash tax rate: Generally tracks the statutory rate (24-26%), though occasionally benefits from discrete items like R&D tax credits or interest on tax refunds.
Sheet Structure
- Assumptions: Hardcoded inputs for macroeconomic drivers, segment growth, margins, working capital days, and M&A placeholders.
- Backlog & Bookings: Roll-forward of backlog for Mechanical and Electrical segments (Beginning Backlog + Bookings - Revenue Recognised = Ending Backlog).
- Revenue Build: Segment-level revenue calculations driven by backlog burn rates and assumed acquired revenue.
- Income Statement: Consolidated P&L down to Net Income and EPS, mirroring the 10-K layout.
- Balance Sheet: Assets, Liabilities, and Equity. Must include specific lines for "Costs and estimated earnings in excess of billings" and "Billings in excess of costs and estimated earnings".
- Cash Flow Statement: Indirect method starting from Net Income, adjusting for D&A, working capital changes, capex, M&A cash outflows, debt issuance/repayment, and dividends/buybacks.
- Debt & Interest Schedule: Tranches of the revolving credit facility, interest expense calculation, and interest income on cash balances.
- Working Capital Schedule: Calculation of receivables, payables, and contract assets/liabilities based on days assumptions.
- Depreciation & Amortisation Schedule: Waterfall of existing D&A plus new capex depreciation and new M&A intangible amortisation.
- DCF Valuation: Unlevered free cash flow calculation, WACC assumptions, terminal value, and implied share price.
Key Financial Relationships
- Mechanical Revenue = (Beginning Mechanical Backlog x Mechanical Burn Rate) + Mechanical Book-and-Bill + Mechanical Acquired Revenue
- Electrical Revenue = (Beginning Electrical Backlog x Electrical Burn Rate) + Electrical Book-and-Bill + Electrical Acquired Revenue
- Total Revenue = Mechanical Revenue + Electrical Revenue
- Consolidated Gross Profit = Total Revenue x Consolidated Gross Margin %
- SG&A Expense = Total Revenue x SG&A Margin %
- Operating Income = Consolidated Gross Profit - SG&A Expense - Amortisation of Intangibles
- Accounts Receivable = (Total Revenue / 365) x DSO
- Accounts Payable = (COGS / 365) x DPO
- Contract Assets (Costs in excess of billings) = (Total Revenue / 365) x Contract Asset Days
- Contract Liabilities (Billings in excess of costs) = (Total Revenue / 365) x Contract Liability Days
- Interest Income = Average Cash Balance x Interest Rate on Cash
- Interest Expense = Average Revolver Balance x Revolver Interest Rate
- Net Income = (Operating Income + Interest Income - Interest Expense) x (1 - Effective Tax Rate)
- Free Cash Flow = Operating Cash Flow - Capital Expenditures
Cross-Sheet Dependencies
- The Assumptions sheet dictates the Book-to-Bill ratio and Burn Rate on the Backlog & Bookings sheet.
- The Backlog & Bookings sheet feeds directly into the Revenue Build sheet.
- The Revenue Build sheet drives the top line of the Income Statement and the activity levels in the Working Capital Schedule.
- The Working Capital Schedule calculates the change in net working capital, which is a critical deduction/addition in the Cash Flow Statement.
- The Cash Flow Statement determines the ending cash and debt balances, which feed the Balance Sheet and the Debt & Interest Schedule.
- The Debt & Interest Schedule calculates interest expense and income, which loop back into the Income Statement. (This is the primary circularity risk; a toggle switch for average vs. beginning balances should be included).
Sign Convention
- Income Statement: Revenue is positive. Expenses (COGS, SG&A, Interest Expense, Taxes) are negative. Net Income is positive if profitable.
- Balance Sheet: All assets, liabilities, and equity balances are positive.
- Cash Flow Statement: Cash inflows (e.g., Net Income, Depreciation, increase in Payables) are positive. Cash outflows (e.g., Capex, M&A, Dividends, increase in Receivables) are negative.
- Calculations: When subtracting an expense from revenue, use addition if the expense is already formatted as a negative number.
Things Most Likely to Go Wrong
- Percentage-of-Completion Volatility: The model must accurately reflect that revenue is tied to backlog burn. If the builder disconnects revenue from the backlog roll-forward, the model will fail to capture the reality of the contracting business.
- Contract Assets vs. Liabilities: Failing to model "Costs in excess of billings" (asset) and "Billings in excess of costs" (liability) separately. These are massive working capital drivers for Comfort Systems.
- M&A Amortisation: Comfort Systems acquires heavily. The builder must include a mechanism to increase intangible amortisation when M&A revenue is added, otherwise operating margins will be artificially inflated.
- Interest Income vs. Expense: Because FIX has $981M in cash and only $145M in debt, it generates net interest income. The model must calculate interest on cash balances, not just interest on debt.
- Circularity in Cash and Debt: The revolver balance depends on cash flow shortfalls, which depend on interest expense, which depends on the revolver balance. Use a circuit breaker or beginning-balance logic.
- Gross Margin Over-Extrapolation: FY2025 gross margins were a record 24.1%. Extrapolating this upward indefinitely is dangerous; the model should revert to a long-term mean or hold flat, as contracting margins are cyclical.
- Share Count Reduction: The company actively repurchases shares. The EPS calculation must use a dynamically shrinking diluted share count based on the buyback assumptions.
- Acquisition Cash Outflows: If the model assumes acquired revenue growth, it MUST include a corresponding cash outflow for M&A in the Cash Flow Statement, otherwise Free Cash Flow will be wildly overstated.
Validation Checks
- Balance Sheet Balancing: Total Assets must exactly equal Total Liabilities + Shareholders' Equity in all periods.
- Gross Margin Band: Gross margin should remain between 20.0% and 25.0%. Flag if it exceeds 25.0%.
- Cash Conversion: Operating Cash Flow divided by Net Income should consistently be between 1.0x and 1.3x.
- Capex Intensity: Capex as a percentage of revenue must remain between 1.0% and 2.0%.
- Leverage Check: Gross Debt / EBITDA should remain below 2.0x (currently 0.10x).
- Backlog Coverage: Total Revenue should not exceed Beginning Backlog + In-Period Bookings.
- Effective Tax Rate: Should remain between 23.0% and 26.0%.
- Dividend Payout: Dividend per share growth should not cause the payout ratio to exceed 20% of Net Income.
Key Assumptions (Default Values)
| Assumption | Default Value | Unit | Rationale |
|---|---|---|---|
| Mechanical Book-to-Bill Ratio | 1.15 | x | Reflects strong ongoing demand in industrial and tech sectors. |
| Electrical Book-to-Bill Ratio | 1.10 | x | Steady growth in electrification and data centre power needs. |
| Backlog Burn Rate (Annual) | 75.0 | % | Average project duration is 6-9 months; most backlog converts within the year. |
| Consolidated Gross Margin | 24.1 | % | Held flat from record FY2025 levels. |
| SG&A as % of Revenue | 9.5 | % | In line with historical averages and FY2025 performance. |
| D&A as % of Revenue | 2.0 | % | Reflects ongoing amortisation of acquired intangibles. |
| Days Sales Outstanding (DSO) | 75 | Days | Based on historical receivables turnover. |
| Days Payable Outstanding (DPO) | 60 | Days | Based on historical payables turnover. |
| Capex as % of Revenue | 1.2 | % | Asset-light business model requires minimal maintenance capex. |
| Annual M&A Spend | 250 | $ Millions | Assumes continuation of historical bolt-on acquisition strategy. |
| M&A Purchase Multiple | 7.0 | x EBITDA | Standard industry multiple for private MEP contractors. |
| Interest Rate on Cash | 4.0 | % | Assumes conservative yield on $981M cash balance. |
| Interest Rate on Debt | 6.5 | % | Estimated SOFR + spread on the revolving credit facility. |
| Effective Tax Rate | 24.5 | % | Blended US federal and state statutory rates. |
| Annual Share Repurchases | 200 | $ Millions | In line with FY2025 actual repurchases ($217.9M). |
| Dividend Per Share | 1.95 | $ | Actual FY2025 dividend, with assumed 5% annual growth thereafter. |
| WACC | 9.5 | % | Reflects low beta but cyclical end-market exposure. |
| Terminal Growth Rate | 2.5 | % | Long-term GDP growth proxy. |
Data Sources & Benchmarks
- SEC EDGAR: Primary source for 10-K, 10-Q, and 8-K filings.
- Investor Relations: Comfort Systems USA website (comfortsystemsusa.com) for quarterly earnings presentations and the FY2025 Investor Presentation.
- Key Peers for Benchmarking: EMCOR Group (EME), Quanta Services (PWR), MasTec (MTZ), API Group (APG).
- Industry Data Sources: Dodge Construction Network (for commercial/industrial starts), ABI (Architecture Billings Index) as a leading indicator for non-residential construction.
Sources
- Comfort Systems USA FY2025 10-K Filing (SEC EDGAR)
- Comfort Systems USA Q4 and Full Year 2025 Earnings Release
- Comfort Systems USA February 2026 Investor Presentation
- Comfort Systems USA M&A Press Releases (Summit Industrial Construction, J&S Mechanical, Feyen Zylstra)
Other Industrials models
Browse another company in the same sector.


Frequently asked
What services does Comfort Systems USA (FIX) provide?+
Comfort Systems USA is a leading national provider of mechanical, electrical, and plumbing (MEP) contracting services, primarily for commercial, industrial, and institutional markets. The company specializes in designing, engineering, integrating, installing, and maintaining HVAC, plumbing, piping, and electrical systems, with a recent expansion into modular construction for advanced technology plants.
How does Comfort Systems USA generate its revenue?+
Comfort Systems USA generates revenue primarily through percentage-of-completion project accounting within its asset-light, project-based contracting and services model. Its business is segmented into Mechanical Services, accounting for approximately 73% of revenue, and Electrical Services, making up about 27%.
What is Comfort Systems USA's capital expenditure strategy?+
Comfort Systems USA operates with a highly asset-light business model, with capital expenditure typically representing 1.0% to 1.5% of its revenue. Most of this capex is for maintenance, such as vehicle fleet replacement and tool upgrades, though investments are also made in modular construction fabrication facilities.
What is the purpose of the Comfort Systems USA financial model?+
The Comfort Systems USA financial model provides a comprehensive three-statement forecast and discounted cash flow (DCF) valuation. Its primary purpose is to assist equity research analysts in determining the intrinsic value of the shares and assessing the financial impact of the company's ongoing roll-up acquisition strategy.
Can I download an Excel financial model for Comfort Systems USA (FIX)?+
Yes, a downloadable Excel financial model for Comfort Systems USA (FIX) is available. This model offers a detailed forecast horizon from FY2026 through FY2030, enabling thorough analysis of the company's future financial performance and key assumptions.
How does Comfort Systems USA's acquisition strategy impact its financial model?+
Comfort Systems USA is a serial acquirer, typically completing 2-4 bolt-on or transformational acquisitions annually, which is a significant driver of its growth. This M&A strategy results in a balance sheet with extremely high goodwill and intangible assets, often representing 40-50% of total assets.
Want to build your own Comfort Systems USA financial model?
Copy a ready-to-use prompt with every driver, historical, and assumption baked in — or have a custom model built for you.
The prompt includes the full company brief, 5 years of SEC historicals, and the default forecast assumptions used in the downloadable model.

Alex Tapio
Founder of Finamodel • Professional Financial Modeller • Ex-Deloitte