
Adobe Free Financial Model Download
Adobe Inc.
Adobe Inc. is a global software company that provides content creation, document management, and digital marketing solutions.
Free download. No sign-up required. Built from SEC EDGAR data.
About this model
This model projects Adobe's future cash flows and earnings to determine an intrinsic equity valuation, helping an equity research analyst decide whether the stock is a buy, hold, or sell based on its transition to AI-monetised subscription tiers.
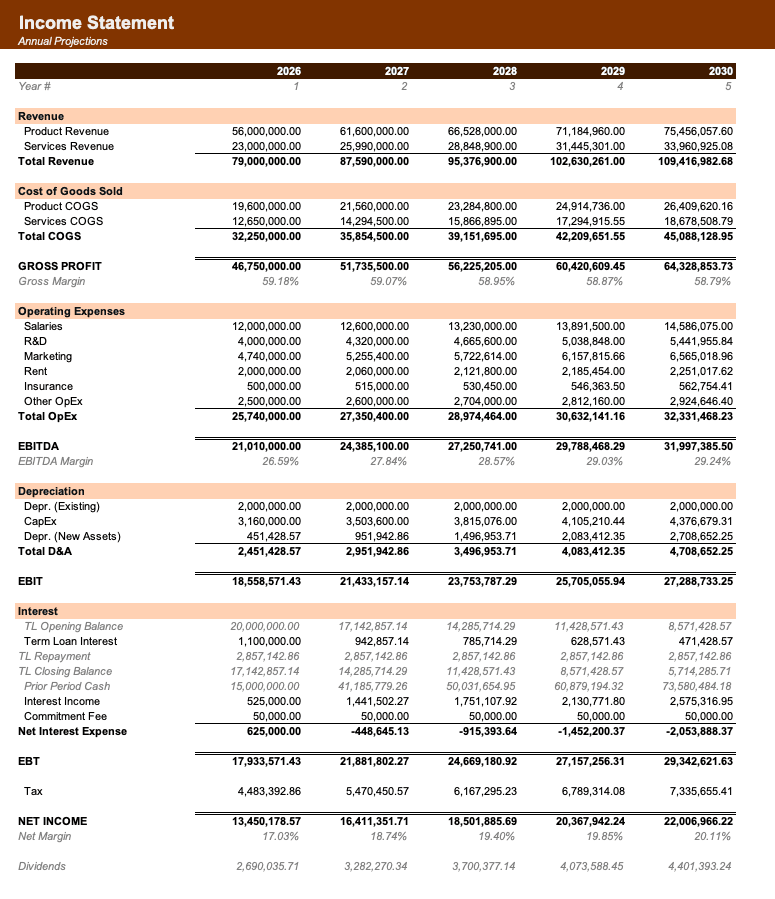
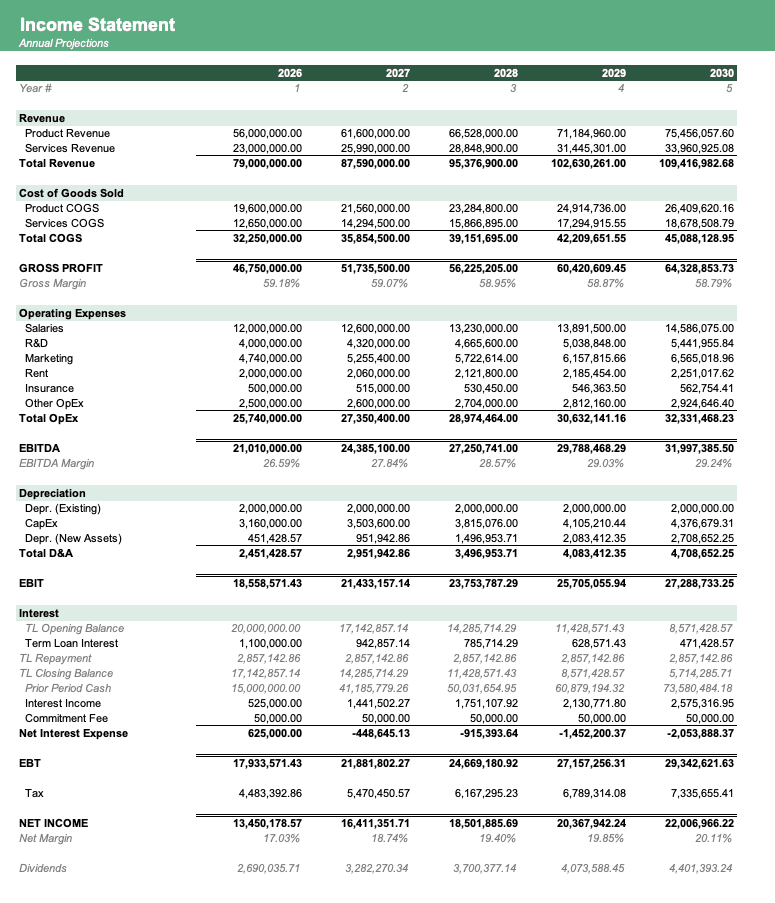
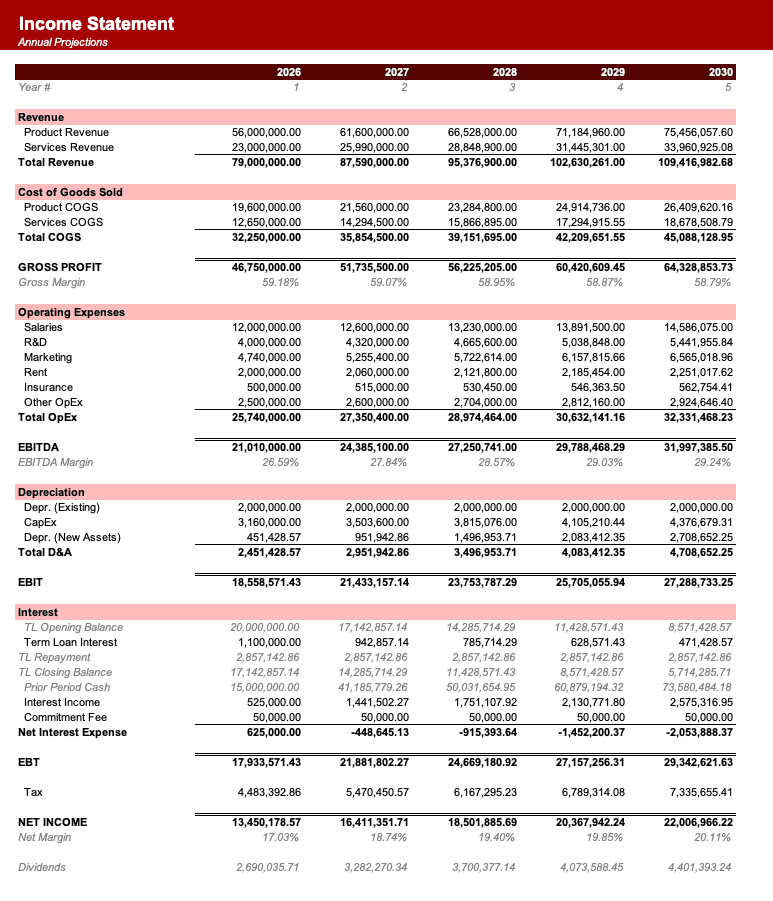
Recolor to your brand.
Formatted to IB standards.
Named theme colors repaint the whole workbook in one click, on top of an investment-banking structure with blue inputs, black formulas, and green cross-sheet links.
- Brand-ready
- Institutional grade
- Fully auditable
Historicals & Assumptions used in
the Adobe financial model
Source: SEC EDGAR · values in USD
| Line item | FY2021 | FY2022 | FY2023 | FY2024 | FY2025 |
|---|---|---|---|---|---|
| Revenue | $11.17B | $12.87B | $15.79B | $17.61B | $19.41B |
| Gross profit | $9.50B | $11.15B | $13.92B | $15.44B | $17.05B |
| Operating income | $3.27B | $4.24B | $5.80B | $6.10B | $6.65B |
| Net income | $2.95B | $5.26B | $4.82B | $4.76B | $5.43B |
Forecast assumptions
Defaults used in the downloadable model. Forecast horizon: FY2026–FY2030.
See 8 moreSee less
How to build a detailed financial model for Adobe
A complete walkthrough of every driver, margin, working-capital input, and capital-allocation assumption used in the downloadable model.
Revenue Deep Dive
Digital Media
- Segment name: Digital Media (includes Creative Cloud and Document Cloud)
- Revenue driver formula: Beginning Annualised Recurring Revenue (ARR) + Net New ARR = Ending ARR (which converts to recognised revenue)
- Historical growth rate: 10% to 12% YoY (FY2025 growth was 11%)
- Key growth levers and headwinds: Levers include seat expansion, pricing power, and upselling premium AI tiers like Firefly. Headwinds include macroeconomic pressure on freelance creatives and competition from lower-cost design tools.
- Pricing dynamics: Contractual subscription pricing with tiered plans for individuals, teams, and enterprises.
- Revenue recognition notes: Recognised ratably over the subscription term.
- Seasonality: Q4 is typically the strongest quarter for enterprise bookings and Net New ARR generation.
Digital Experience
- Segment name: Digital Experience
- Revenue driver formula: Subscription Revenue + Professional Services Revenue
- Historical growth rate: 9% to 11% YoY (FY2025 growth was 9%)
- Key growth levers and headwinds: Levers include enterprise digital transformation budgets and adoption of the Adobe Experience Platform. Headwinds include elongated enterprise sales cycles and intense competition from Salesforce.
- Pricing dynamics: Contractual, often based on capacity, data volume, or specific module usage.
- Revenue recognition notes: Subscription revenue is recognised ratably over time, while professional services are recognised as the services are delivered.
- Seasonality: Heavy Q4 weighting due to enterprise IT budget flush and annual contract renewals.
Publishing and Advertising
- Segment name: Publishing and Advertising
- Revenue driver formula: Legacy Product Volume x Price + Advertising Cloud Volume x Take Rate
- Historical growth rate: Declining at 10% to 15% annually
- Key growth levers and headwinds: This is a legacy segment in secular decline; management does not focus on growing this business.
- Pricing dynamics: Spot pricing for advertising, perpetual licenses for legacy publishing tools.
- Revenue recognition notes: Recognised upfront upon delivery for software, or as transactions occur for advertising.
- Seasonality: Minimal seasonality.
Cost Structure
Variable Costs / COGS
- Line-by-line breakdown: Subscription COGS (cloud hosting on AWS/Azure, royalty fees, technical support) and Product/Services COGS (consulting personnel costs).
- Gross margin range: 89% to 91% (Q4 FY2025 GAAP gross margin was 90.4%).
- Key input costs and commodity exposures: Cloud computing infrastructure costs and third-party royalty agreements.
- How COGS scales with revenue: Highly scalable with massive operating leverage, as adding a new software subscriber incurs near-zero marginal cost.
Operating Expenses
- R&D: Typically 17% to 19% of revenue. It covers software engineering, AI model training, and cloud infrastructure development. Adobe capitalises very little R&D.
- SG&A: Sales and Marketing is the largest expense at 27% to 29% of revenue, driven by headcount, commissions, and digital advertising. General and Administrative runs at 6% to 8% of revenue.
- Depreciation & Amortisation: Relatively low as a percentage of revenue, mostly related to the amortisation of acquired intangible assets from past M&A.
- Stock-Based Compensation: High, running at 7% to 9% of revenue, which is standard for large-cap technology firms competing for engineering talent.
- Restructuring / one-time charges: Infrequent, though occasional acquisition termination fees (such as the Figma break fee) can cause one-time spikes.
Margin Profile
- Gross margin: 89% to 91%.
- Operating margin: GAAP operating margin ranges from 33% to 36%, while Non-GAAP operating margin (excluding SBC and amortisation) ranges from 45% to 47%.
- Net margin: 28% to 30% on a GAAP basis.
- Margin trend: Stable to slightly expanding as AI monetisation scales and offsets the initial heavy compute costs of generative AI training.
Balance Sheet Structure
- Total assets: Approximately $30 billion.
- Key asset categories: Cash and short-term investments ($7 billion to $8 billion), Goodwill and Intangibles ($13 billion to $15 billion).
- Goodwill & intangibles as % of total assets: Roughly 45% to 50%, reflecting a history of significant acquisitions like Marketo, Magento, and Workfront.
- Working capital profile:
- Days Sales Outstanding (DSO): 35 to 45 days.
- Days Inventory Outstanding (DIO): 0 days (not applicable for software).
- Days Payable Outstanding (DPO): 25 to 35 days.
- Net working capital as % of revenue: Deeply negative.
- Is working capital positive or negative? Negative. Adobe funds its growth through working capital because customers pay upfront for annual subscriptions, creating massive deferred revenue liability balances.
- PP&E: Minimal (less than $2 billion), consisting mostly of leasehold improvements and data centre equipment.
- Right-of-use assets / operating leases: Material but manageable, representing office space leases globally.
Capital Expenditure & Investment
- Capex as % of revenue: 2% to 3%.
- Maintenance capex vs. growth capex: Almost entirely growth capex related to expanding server capacity for AI workloads and facility upgrades.
- Major capex programmes underway or planned: Investments in GPU clusters and data centre infrastructure to support Firefly generative AI.
- Capitalised software / development costs: Minimal, as Adobe expenses the vast majority of its R&D as incurred.
- M&A pattern: Historically a serial acquirer of bolt-on and transformational technologies, though regulatory pushback on the Figma deal may force a shift toward organic growth.
- Typical acquisition multiple paid: 10x to 15x forward revenue for high-growth SaaS targets.
Debt & Capital Structure
- Total debt: Approximately $4 billion to $5 billion in senior notes.
- Net debt: Negative, as cash balances exceed total debt.
- Debt/EBITDA ratio: Well below 1.0x.
- Credit rating: A+ / A2 investment grade.
- Key debt instruments: Unsecured senior notes with staggered maturities.
- Maturity profile: Well-laddered with manageable near-term maturities.
- Interest rate profile: Primarily fixed-rate bonds with a low weighted average cost of debt.
- Covenants: Standard investment-grade covenants; no restrictive financial maintenance covenants.
- Share repurchase programme: Highly active. Adobe repurchased 30.8 million shares in FY2025, returning significant capital to shareholders.
- Dividend policy: Adobe does not pay a regular dividend, preferring to return capital via share buybacks.
Cash Flow Characteristics
- Operating cash flow conversion: Exceptionally strong, with OCF / Net Income typically running between 1.3x and 1.5x (FY2025 OCF was $10.03 billion on $7.13 billion GAAP net income).
- Free cash flow margin: 38% to 42% of revenue.
- Major non-cash items: Stock-based compensation, depreciation and amortisation, and deferred income taxes.
- Working capital cash flow impact: Significant source of cash. As the business grows, the deferred revenue balance grows, providing a continuous cash float.
- Capex intensity: Very low, resulting in free cash flow that closely mirrors operating cash flow.
- Cash tax rate vs. GAAP effective tax rate: Cash taxes are often lower than the GAAP effective rate due to tax deductions related to stock-based compensation.
Sheet Structure
- Assumptions: Hardcoded inputs for revenue growth, margin targets, working capital days, and capital return policies.
- ARR Roll-Forward: Tracks Digital Media Beginning ARR, Net New ARR, and Ending ARR to forecast future revenue visibility.
- Revenue Build: Calculates recognised revenue for Digital Media, Digital Experience, and Publishing and Advertising based on ARR and subscription growth rates.
- Income Statement: Projects segment revenues, COGS, R&D, Sales and Marketing, General and Administrative, and calculates both GAAP and Non-GAAP operating income.
- Balance Sheet: Forecasts assets, liabilities, and equity, with specific line items for Deferred Revenue, Goodwill, and Short-Term Investments.
- Cash Flow Statement: Reconciles Net Income to Operating Cash Flow (adding back SBC and D&A), Cash from Investing (Capex), and Cash from Financing (Share Repurchases).
- Debt Schedule: Tracks senior note balances, maturities, and calculates interest expense based on weighted average rates.
- Working Capital: Projects Accounts Receivable, Accounts Payable, and Deferred Revenue based on days outstanding and billings.
- DCF Valuation: Calculates unlevered free cash flow, applies the WACC, and determines the terminal value to arrive at an implied share price.
Key Financial Relationships
- "Digital Media Ending ARR = Digital Media Beginning ARR + Net New Digital Media ARR"
- "Digital Media Revenue = (Beginning ARR + Ending ARR) / 2 * Conversion Factor"
- "Digital Experience Subscription Revenue = Prior Year Subscription Revenue * (1 + Digital Experience Subscription Growth Rate)"
- "Total Revenue = Digital Media Revenue + Digital Experience Revenue + Publishing and Advertising Revenue"
- "Subscription COGS = Total Subscription Revenue * Subscription COGS Margin"
- "Non-GAAP Operating Income = GAAP Operating Income + Stock-Based Compensation + Amortisation of Intangibles"
- "Deferred Revenue Ending Balance = Deferred Revenue Beginning Balance + Total Billings - Recognised Revenue"
- "Free Cash Flow = Operating Cash Flow - Capital Expenditures"
- "Ending Share Count = Beginning Share Count - (Share Repurchase Spend / Average Share Price) + Options Dilution"
- "Interest Expense = Average Debt Balance * Weighted Average Interest Rate"
Cross-Sheet Dependencies
The Assumptions sheet feeds the ARR Roll-Forward and the Revenue Build. The ARR Roll-Forward dictates the top line of the Digital Media segment in the Revenue Build. The Revenue Build populates the top line of the Income Statement. Net Income from the Income Statement flows to the top of the Cash Flow Statement. Changes in working capital on the Cash Flow Statement are driven by the Working Capital schedule. The ending cash balance from the Cash Flow Statement flows into the Balance Sheet. The Debt Schedule calculates interest expense which feeds back into the Income Statement, creating a circular reference that must be managed with a circuit breaker toggle.
Sign Convention
Revenue, assets, and equity balances must be entered as positive numbers. Expenses (COGS, R&D, SG&A) should be calculated as positive numbers in their respective schedules but explicitly subtracted in the Income Statement aggregation. On the Cash Flow Statement, cash inflows are positive, and cash outflows (such as capital expenditures and share repurchases) must be negative.
Things Most Likely to Go Wrong
- Confusing ARR with GAAP Revenue; ARR is an annualised run-rate metric and cannot be directly plugged into the Income Statement without a conversion calculation.
- Failing to model deferred revenue correctly, which is the critical bridge between customer billings and recognised revenue.
- Ignoring the massive Stock-Based Compensation add-back, which artificially depresses GAAP margins compared to the Non-GAAP metrics that management and Wall Street actually track.
- Miscalculating share count reductions; Adobe's aggressive buyback programme significantly boosts EPS and must be modelled dynamically based on cash flow available for financing.
- Overestimating Capex; Adobe is highly asset-light, and Capex should not scale linearly with revenue beyond the historical 2% to 3% band.
- Modelling Publishing and Advertising as a growth segment; it is a legacy business in secular decline and should be modelled with negative growth.
- Forgetting to separate Subscription COGS from Services COGS; professional services have much lower gross margins and skew the blended margin if not separated.
- Applying a standard positive working capital assumption; Adobe operates with negative net working capital, meaning growth generates cash rather than consuming it.
Validation Checks
- Total Gross Margin should remain between 89% and 91% in all forecast years.
- Non-GAAP Operating Margin should be between 45% and 47% based on management's FY2026 guidance.
- Operating Cash Flow should exceed GAAP Net Income by at least 20% in every period due to deferred revenue and SBC dynamics.
- Digital Media ARR growth should track closely with Digital Media revenue growth (typically within 100 to 200 basis points).
- Capex as a percentage of revenue should not exceed 3% without a specific flagged assumption change.
- The Balance Sheet must balance perfectly: Total Assets = Total Liabilities + Equity in every period.
- Effective tax rate should remain around 18% to 20% based on historical non-GAAP tax provisions.
- Share count should decrease year-over-year as long as the share repurchase assumption remains active.
Key Assumptions (Default Values)
| Assumption | Default Value | Unit | Rationale |
|---|---|---|---|
| Digital Media ARR Growth | 11.5 | % | FY2025 actual growth rate |
| Digital Experience Rev Growth | 9.0 | % | FY2025 actual growth rate |
| Publishing & Advertising Growth | -14.0 | % | Based on Q4 FY2025 YoY decline |
| Gross Margin | 90.4 | % | Q4 FY2025 actual GAAP gross margin |
| R&D as % of Revenue | 17.5 | % | Historical average |
| Sales & Marketing as % of Rev | 27.5 | % | Historical average |
| G&A as % of Revenue | 7.0 | % | Historical average |
| Stock-Based Comp as % of Rev | 8.0 | % | Typical run-rate for Adobe |
| Capex as % of Revenue | 2.5 | % | Asset-light software model |
| Effective Tax Rate | 18.5 | % | Historical non-GAAP tax rate |
| Annual Share Repurchases | 8.0 | $ Billions | Based on aggressive FY2025 buyback activity |
| WACC | 8.5 | % | Standard software large-cap discount rate |
| Terminal Growth Rate | 3.0 | % | Long-term GDP plus software premium |
Data Sources & Benchmarks
- SEC EDGAR for Adobe 10-K and 10-Q filings.
- Adobe Investor Relations page for quarterly earnings presentations, financial data sheets, and ARR historicals.
- Key peers for benchmarking: Salesforce (CRM), Oracle (ORCL), Microsoft (MSFT), and Autodesk (ADSK).
- Consensus estimates source: FactSet or Bloomberg for validation of near-term revenue and EPS outputs.
Sources
- Adobe Q4 FY2025 Earnings Release and Financial Data Sheet (December 10, 2025).
- Adobe FY2024 Annual Report on Form 10-K.
- Futurum Group Analyst Reports on Adobe Q4 FY2025 Performance.
- Investing.com and TradingView summaries of Adobe FY2025 financial results.
Other Information Technology models
Browse another company in the same sector.


Frequently asked
What does Adobe Inc. do?+
Adobe Inc. is a global software company that provides content creation, document management, and digital marketing solutions. The company operates primarily through a cloud-based subscription model, serving individual creators, small businesses, and large enterprises.
How does Adobe generate its revenue?+
Adobe generates revenue primarily through its cloud-based subscription model, with its Digital Media segment accounting for approximately 74% of revenue. The aggressive rollout of Firefly generative AI features throughout 2024 and 2025 significantly drove FY2025 total revenue to a record $23.77 billion.
What is Adobe's capital expenditure strategy?+
Adobe's capital expenditure (Capex) is typically 2% to 3% of revenue, consisting almost entirely of growth capex. These investments are focused on expanding server capacity for AI workloads and facility upgrades to support Firefly generative AI.
What is the purpose of the Adobe financial model?+
This financial model projects Adobe's future cash flows and earnings to determine an intrinsic equity valuation. It assists an equity research analyst in deciding whether the stock is a buy, hold, or sell, particularly in light of its transition to AI-monetised subscription tiers.
Can I download an Excel financial model for Adobe?+
Yes, an Excel financial model for Adobe Inc. is available for download. This general corporate model provides financial projections for the forecast horizon of FY2026 through FY2030.
How does Adobe's subscription model impact its working capital?+
Adobe's highly asset-light, subscription-based business model results in deeply negative net working capital. This occurs because customers often pay upfront for annual subscriptions, creating massive deferred revenue liability balances that effectively fund the company's growth.
Want to build your own Adobe financial model?
Copy a ready-to-use prompt with every driver, historical, and assumption baked in — or have a custom model built for you.
The prompt includes the full company brief, 5 years of SEC historicals, and the default forecast assumptions used in the downloadable model.

Alex Tapio
Founder of Finamodel • Professional Financial Modeller • Ex-Deloitte